Biodiversity Metrics Every Corporation Should Track
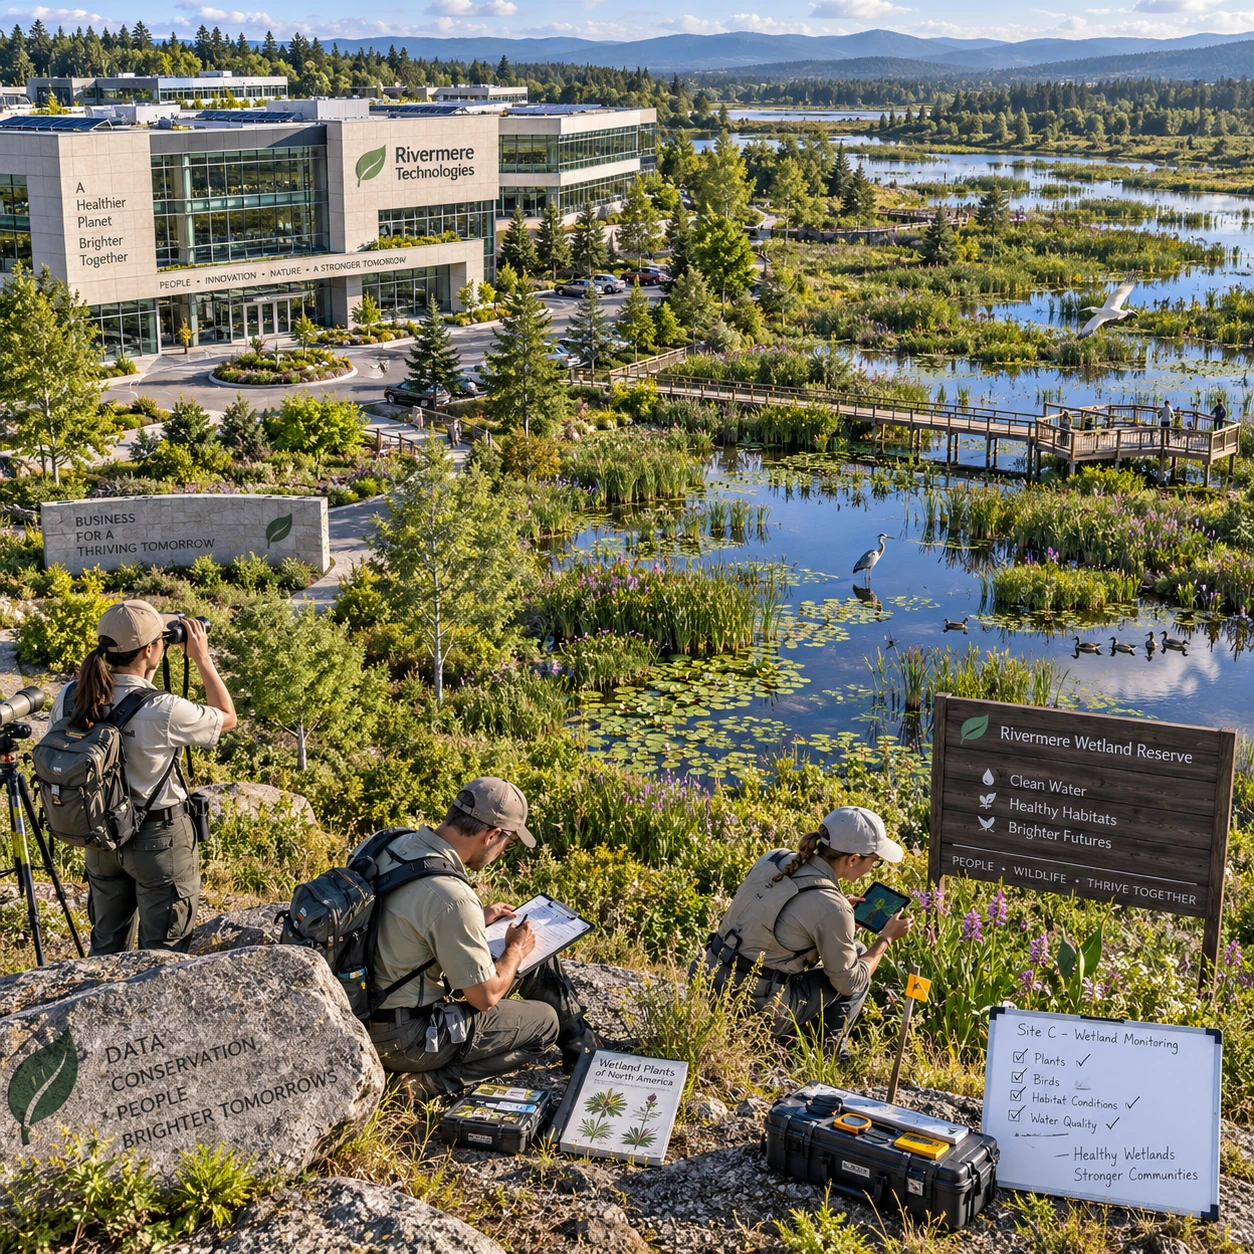
Corporate biodiversity monitoring works best when it connects what happens on the ground to decisions across operations and supply chains. A useful set of metrics tracks habitat, species, ecosystem condition, and the pressures that can change them over time.
Why biodiversity metrics matter to corporations
Biodiversity metrics help corporations understand how their activities affect nature and how business operations depend on healthy ecosystems. Tracking indicators over time can reveal risks such as declining water quality, pollinator loss, soil degradation, or damage to habitats that support production.
These measurements are useful for more than reporting. A company can use them to identify priority sites, assess nature-related impacts and dependencies, compare operational alternatives, and decide where to prevent harm or invest in restoration. For example, a facility drawing water from a sensitive watershed may need to monitor both water use and the condition of nearby freshwater habitats.
Biodiversity is not interchangeable with carbon accounting. A single emissions figure can summarize one climate pressure, but biodiversity reflects many living systems and local ecological relationships. No single biodiversity score captures every impact. A stronger monitoring program pairs habitat and species indicators with pressure measures, then interprets results in their local context.
Start with a baseline and define the scope
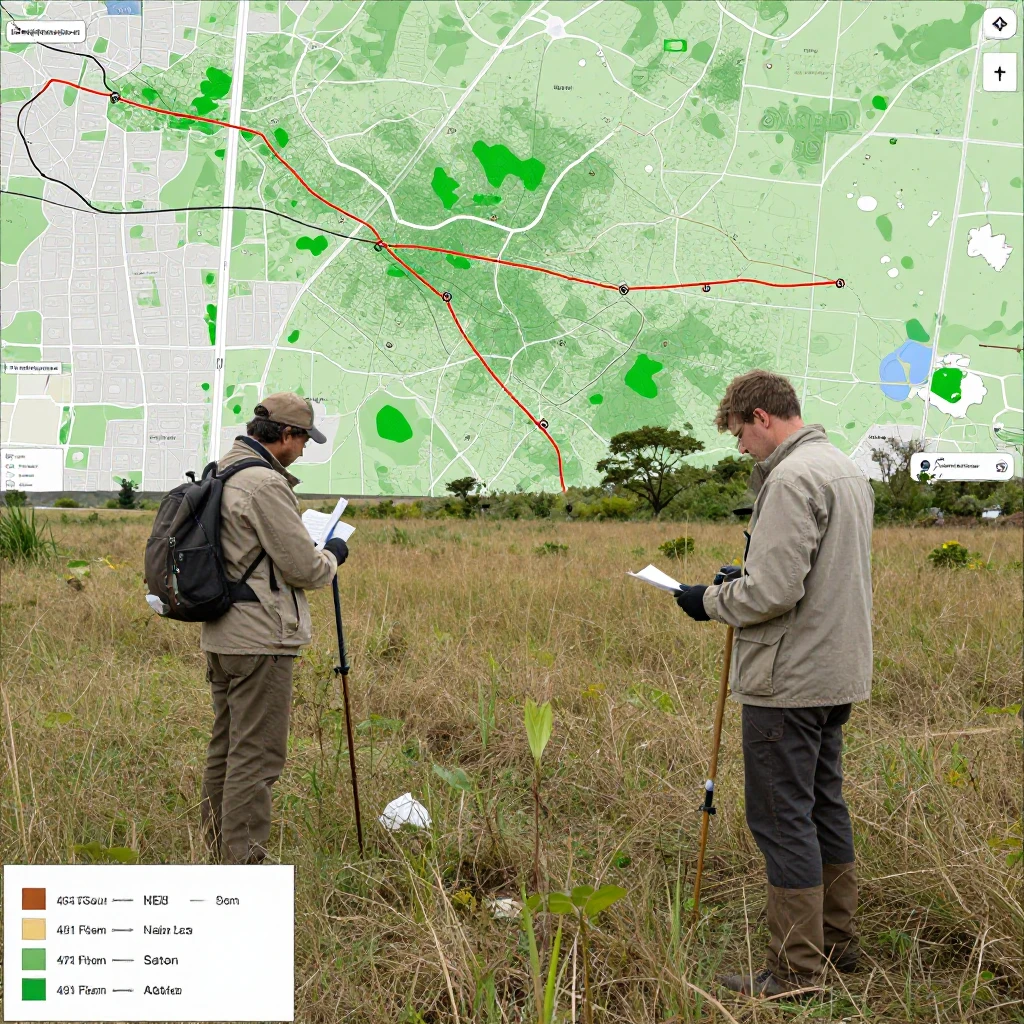
Begin by mapping where the company operates and sources materials, then establish location-specific baselines before setting targets. A baseline records the starting condition against which later changes can be assessed.
Include owned and managed sites, major infrastructure, and relevant parts of the supply chain. Prioritize locations where operations or sourcing overlap with sensitive habitats, threatened species, water stress, or substantial land-use change. A risk screen helps narrow the field, but it should not replace field assessment where ecological impacts may be significant.
Define the area, indicators, methods, and monitoring period for each location. Record season and sampling conditions, since bird activity, plant growth, and species detectability vary through the year. A survey conducted in spring may not be directly comparable with one conducted in late summer.
Supply-chain biodiversity can be difficult to measure because impacts occur far from company-owned sites. Start with high-impact commodities and trace them to production regions where feasible. Document gaps in traceability rather than treating unknown origins as low risk. Consistent boundaries and monitoring periods make the baseline useful; changing them without explanation can create misleading trends.
Track habitat extent and condition
Measure habitat extent and condition to see how much natural or semi-natural habitat remains and whether its ecological quality is changing. Area alone is a useful starting point, but it cannot show whether a habitat is healthy or connected.
Track land cover and habitat area by type, such as forest, grassland, wetland, river corridor, or coastal habitat. Use consistent maps and classification methods to identify conversion, expansion, or restoration. Remote sensing can help monitor broad land-use change, while field checks verify what satellite imagery cannot reliably distinguish.
Pair extent with condition indicators. Depending on the ecosystem, these may include native vegetation cover, invasive species, soil condition, water quality, structural diversity, or evidence of natural regeneration. Fragmentation also matters: a large area split into isolated patches may support fewer species than a connected landscape of similar size.
- Habitat extent: area of each relevant habitat type within the defined boundary.
- Habitat condition: locally appropriate measures of ecological quality.
- Connectivity: the degree to which habitat patches remain linked.
- Restoration progress: area restored, survival of planted vegetation, and recovery of ecological functions.
Restoration activity is not proof of ecological recovery. Report actions separately from outcomes, and allow enough time for habitat condition and species indicators to respond.
Monitor species and ecological health
Monitor species richness, species abundance, and threatened or sensitive species to understand how ecological communities respond to business activity. Use several indicators because each reveals a different part of the picture.
Species richness counts how many species are recorded in a defined area. Species abundance measures the number of individuals or, where exact counts are impractical, a consistent estimate of population size. A site can retain the same number of species while common generalists increase and sensitive species decline, so richness alone may hide important change.
Record threatened species and locally sensitive species, including those protected under applicable national or regional rules. Their presence can signal a need for stronger safeguards or more detailed surveys. Use suitable methods for the organisms involved: vegetation plots for plants, acoustic monitoring for some birds and bats, camera traps for mammals, or aquatic surveys for freshwater species.
For a useful time series, keep survey methods, season, sampling effort, and locations as consistent as possible. Note detection limits and changes in observer or equipment. Ecosystem integrity is broader than a species list; it includes the composition and function of ecological communities. Species data should therefore be interpreted alongside habitat condition and pressure indicators.
Measure pressures on biodiversity
Track the pressures that drive biodiversity change, including land-use change, pollution, resource use, and disturbance. Pressure metrics help explain why habitat or species indicators may be improving or deteriorating.
Relevant measures depend on the company’s activities and location. A manufacturer might track land converted, water withdrawn, wastewater quality, pesticide use, and light or noise near sensitive habitat. An agricultural buyer may need data on production-area expansion, fertilizer and pesticide application, soil erosion, and water use. For infrastructure, road construction, habitat fragmentation, and construction disturbance may be material.
- Land converted or disturbed, reported by habitat type and location.
- Water abstraction, discharge quality, and changes to natural flow where relevant.
- Pollutant releases, pesticide or fertilizer use, and waste reaching ecosystems.
- Resource extraction and harvesting pressure on wild species or habitats.
- Noise, artificial light, traffic, and other ongoing disturbance near sensitive areas.
Separate direct operational pressures from those linked to suppliers. A lower pressure figure does not automatically mean nature has recovered, especially if impacts persist or occur elsewhere. Pair pressure data with ecological outcomes to test whether actions are making a measurable difference.
Turn metrics into business decisions
Use biodiversity metrics to identify priorities, set measurable targets, and choose actions, rather than relying on one score to represent performance. A practical decision process links a location, its pressures, its ecological condition, and a response.
First, examine trends against the baseline and note uncertainty. Next, ask what may be driving the change and whether it is connected to company activity. Then select a response in order: avoid damage where possible, reduce remaining pressures, restore affected areas, and monitor outcomes. A site showing falling native plant cover alongside expanding disturbance may need operational changes before restoration work can succeed.
Targets should specify a metric, location, timeframe, and method of verification. For example, a company could commit to reducing conversion of natural habitat in a defined sourcing region by a stated date, while separately monitoring habitat condition and species response. Avoid universal thresholds: an acceptable condition or recovery rate depends on the ecosystem and local context.
Use disaggregated results for decisions. An aggregate company-wide figure can conceal severe deterioration at one site behind improvements elsewhere. Location-level trends and transparent trade-offs provide a more credible basis for capital planning, supplier engagement, and operational changes.
Make monitoring credible and useful
Credible biodiversity monitoring uses repeatable methods, local ecological expertise, quality-checked data, and transparent reporting. These safeguards help companies distinguish real ecological change from differences in sampling or interpretation.
Choose methods suited to the habitat, species, and decision being made. Work with qualified local ecologists and relevant rights-holders or communities where appropriate; local knowledge can identify seasonal patterns and ecological features that a remote assessment misses. Keep records of survey design, dates, effort, equipment, and limitations.
Use a monitoring frequency that matches the pace of change and the sensitivity of the site. Annual surveys may suit some indicators, while rapidly changing pressures or seasonal species may need more frequent checks. Whatever the schedule, compare like with like and explain any method changes. Independent review can strengthen confidence when results inform public claims or high-stakes decisions.
Report both actions and outcomes, including uncertainty, data gaps, and cases where indicators worsened. Biodiversity monitoring is most useful when it leads to a management response and then tests whether that response worked. A dashboard can make trends easier to follow, but it should preserve the underlying location-specific evidence rather than compressing it into an unexplained score.